Table of Contents
Remote online analysis using nptool (RIKEN-LPC)
In order to run an online analysis from RIKEN to LPC you will need ssh access to both ubuntu20 (LPC side) and expand (RIKEN side). Port 8080,8081 and 8082 of expand are redirected to port 10080,10081 and 10082 respectively on ubuntu20.
In this scheme we launch npconversion and npanalysis on expand. nponline is launch on ubuntu20 to avoir high latency with the interface. A tunnel between unbunt20 and your local computer is desirable.
Step 1: Run npconversion on expand
ssh expand
tmux_online
Step 2: running nponline on ubuntu20
ssh ubuntu20
/local/nebula_plus/online.sh
Step 3: tunnel from ubuntu20 to local machine
Either start a tunnel
ssh -L 8082:localhost:8082 ubuntu20
Or add a special ssh connection to your ~/.ssh/config
Host ubuntu20
	Hostname ubuntu20
	ProxyJump caelogin.in2p3.fr
	LocalForward 8082 localhost:8082
In the last case, simply ssh to ubuntu20 before going to step 4 and keep your terminal open.
Step 4: spectra visualisation
Launch your favorite web browser and visit localhost:8082 . You may have to edit permission on this website to allow : JavaScript, Pop-Up widows and Background update.
Remote online analysis using nptool (RIKEN-RIKEN)
In order to run an online analysis from RIKEN to LPC you will need ssh access to both ubuntu20 (LPC side) and expand (RIKEN side). Port 8080,8081 and 8082 of expand are redirected to port 10080,10081 and 10082 respectively on ubuntu20.
In this scheme we launch npconversion and npanalysis on expand. nponline is launch on ubuntu20 to avoir high latency with the interface. A tunnel between unbunt20 and your local computer is desirable.
Step 1: Run npconversion on expand
ssh expand
tmux_online
Step 2: tunnel from expand to local machine
Either start a tunnel
ssh -L 8082:localhost:8082 expand
Or add a special ssh connection to your ~/.ssh/config
Host expand
	Hostname expand
	LocalForward 8082 localhost:8082
In the last case, simply ssh to expand before going to step 4 and keep your terminal open.
Step 4: spectra visualisation
Launch your favorite web browser and visit localhost:8082 . You may have to edit permission on this website to allow : JavaScript, Pop-Up widows and Background update.
Quick analysis using terminal, on EXPANDACQ
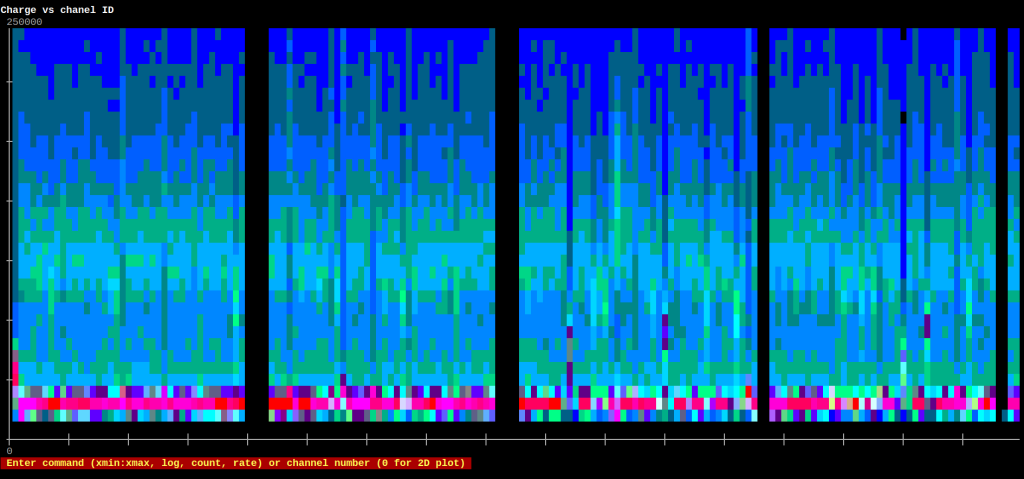
A simple C++ code has been written that display basics histograms directly in the terminal
ssh expand
display_expand [file_name.fast]
If no file name (with path) is given, reads the last written file, even if this one is presently being created
The interface is minimalist. You can type several commands that are listed in the interface :
– 0 gives you raw charges vs channel number (i.e. all PMTs) — default
– any number projects this 2D onto the corresponding channel (1D histogram)
– to zoom between two abscissa, for example 10 and 20, type the values between columns (i.e. here 10:20)
– log gives you logarithmic scale for 2D histograms
– count and `rate` display scaler total counts or rate resp.
Exit with CTRL+c

